Mapping History: Reflections on the Globalization of the United States, 1789-1861 Digital Project
When did the United States become a global force? The answer lies in the nineteenth century, notably before the American Civil War, but this is actually an unhelpfully teleological way of asking the historical question. A more historicist version of the question might be: In the aftermath of national independence, what did various constituencies of Americans strive to do in the wider world, and at what point did such overseas activities attain a global scale?
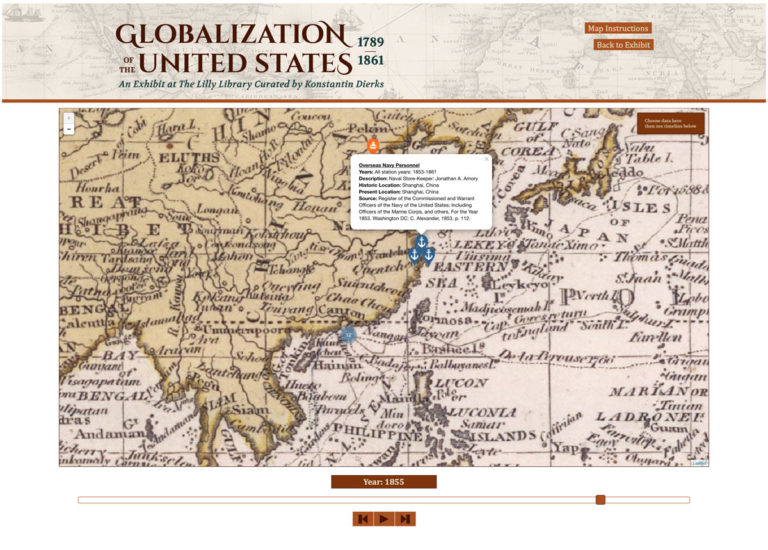
While curating an exhibit for the special collections library at Indiana University, I unexpectedly found myself undertaking a digital history project aimed toward answering this question. I worked with a technical team at the university and beyond to create an interactive digital map designed to trace American activity throughout the world in the formative and transformative era between the Revolution and the Civil War. The exhibit Website, Globalization of the United States, 1789-1861, centers on this map.
Many other digital mapping projects have focused on the spread of networks, but my “globalization map” hinges as much on overlap as it does on reach. Reach: What kinds of activities happened where, and when? Overlap: When did multiple kinds of activities happen in the same place, out in the wider world?
The “globalization map” features ten variables of historical data which plot American diplomatic, military, commercial, missionary, and other activities onto a series of five historical world maps. The digital map is fundamentally interactive so that users can choose from a menu which data to project onto the map, while a timeline enables users to follow data over time. Users can zoom in for more tightly focused views of the five historical maps, and they can click on any data point for background and source information.

Utilizing historical “basemaps” was the first great technical challenge in constructing the digital map: I needed to determine how to project historical data onto world maps from the nineteenth century, rather than onto a modern basemap like Google Maps. This ambition first arose when I sought to produce a map illustration for an academic talk, and I was quickly confronted by the gap between historical places and modern maps. Places existed in the nineteenth century that no longer exist today. Because their world was not our world, a modern basemap simply could not convey the past in its integrity. Sequencing a sample of five historical basemaps through an interactive digital map seemed an apt way to portray Americans’ constantly changing understanding of a constantly changing wider world. The “globalization map” would, through modern digital technology, be able to display a vast array of data, but it would have the appearance of historical maps from the period.
But how could I project data onto historical maps? To utter this question is to recover the depth of my technical ignorance when I embarked on this digital history project. I had to learn—emphatically from ground zero—about “basemaps,” about “historical GIS,” about “georeferencing,” about “tiling,” about database software, about “centroid” “lat-long,” about mapping visualization software, about “CSS” code for timelines and menus, about “back end” engineering, about data management. In other words, I had to learn about what now in retrospect feels like a zillion technical resources, processes, and steps toward creating an interactive digital map for a Website that finally went public after two and a half years of historical research and technical labor.
The “globalization map” and its surrounding Website were all produced on a shoestring budget, alongside constructing a library exhibit, on top of an already heavy academic workload (hence largely on borrowed time), while coordinating an expanding coterie of technical collaborators. There was the reality of numerous steep learning curves, there was the reality of an already onerous workload, and there was the reality of relying on collaborators with their own onerous workloads.
I certainly never foresaw the magnitude of the demands generated by such a digital project when I first undertook it. Yet given what I know now, why continue to develop the “globalization map” as an ongoing labor of love? The project has forced me to rethink my work on multiple levels: to rethink the organization of research, to rethink analysis of evidence, to rethink the representation of history. And to rethink the discipline of history itself. All of that has been tremendously intellectually rewarding.
One responsibility of historical inquiry is to discern in the past what people did not see at the time. No American mapmaker in the nineteenth century ever produced a map comparable to my “globalization map.” At the same time, one burden of historical inquiry is to reconstruct how people in the past understood their own world and what they strove to do in that world. Such an essential tension between their historical time and our historical inquiry lies at the heart of the “globalization map.” It is the reason the digital map utilizes historical basemaps meant to convey past understanding of the world—what people in the past could perceive. And it is the reason the digital map assembles numerous data variables: to examine the multitudinous undertakings pursued by many Americans, all having particular purposes, which would ultimately accumulate into a phenomenon that can retrospectively be labeled “globalization”—but which people in the past did not perceive as such.

Globalization emerged from undertakings not intended to be global. No United States government office orchestrated all this activity, neither the Department of State, nor the Department of War. Yet, the evidence of the current set of data variables for the digital map suggests that, by the late 1830s, the manifold activities of sundry Americans reached both an extent and a saturation level to operate not just on a transatlantic or hemispheric scale but on a truly global scale. Without any imperial plan, the pre-Civil War United States had already been transformed from its marginal colonial and national origins into a significant world power, albeit one considerably short of the then-formidable British empire.
Until recently historians have tended to narrate the nineteenth century—the era before the “American century”—as one of nation building, continental conquest, and sectional conflict, not global expansion. The “globalization map” is meant to contribute to a more multi-dimensional view of the nineteenth century by appreciating Americans’ pursuits at the “global” level beyond the national, beyond the transatlantic, beyond the continental, and beyond the hemispheric.
The data underlying the “globalization map” comes from many sources. The nineteenth century saw a growing array of American social constituencies invest in producing cartographic, geographical, historical, statistical, and other representations of the wider world—both in its parts, and as a global whole. For instance, 1839 saw the formation of the American Statistical Society; 1851, the American Geographical Society. While the textual record of this vast global history is in fragments scattered across innumerable archives, those fragments can be assembled into a research database driving a digital map in order to interrogate how the United States “globalized” across the first half of the nineteenth century.
This points to one way that working on this digital history project has obliged me to rethink the organization of research and the analysis of evidence. Many other digital mapping projects have focused on the spread of networks, but my “globalization map” hinges as much on overlap as it does on reach. Reach: What kinds of activities happened where, and when? Overlap: When did multiple kinds of activities happen in the same place, out in the wider world? Reach can tell us about serious ambition, initiative, and effort, whereas overlap can tell us that much more about serious capability, interaction, involvement, and intervention. The data overlaps on the digital map indicate that the late 1830s is when the United States became a fledgling global force capable of interacting and intervening throughout the world. It was not yet capable of inflicting the kind of damage on the world that the United States would do throughout the twentieth century, but the country had nevertheless become one of the nineteenth century’s few world powers.
Might this be considered globalization, in advance of global imperialism? That is one of the many thorny interpretive questions that can be asked of the “globalization map.” Because the digital map is fundamentally interactive, I can ask my own historical questions of the map, but users can apply the map to their own historical questions far beyond my personal research agenda. Such open-endedness of historical inquiry is the future potential of the project.

Much remains to be done on the “globalization map.” There are representational dilemmas to be overcome, and there are new technological opportunities to be embraced. Some new elements are already in the works. For instance, the number of historical basemaps is being expanded beyond the initial sample of five to one for every year in which an American-produced world map was available. This is meant to deepen the map’s ability to immerse users in historical time—in changing nineteenth-century understandings of a changing world.
And it is meant to slow down the map’s mode of historical inquiry, to linger over sundry overseas activities year by year, so as not to hasten toward any teleological threshold of global saturation. What came before such global saturation was not self-conscious or unified “globalization.” Deliberately slowing users down might help the digital map recast globalizing as a grounded, arduous, and fraught process, rather than as some kind of timeless human condition. In this way “the global” can be interrogated, rather than presumed, as a category of historical analysis.
Additional data shall be plotted onto the “globalization map” beyond the ten initial data variables: American-sponsored scientific expeditions, for example. But how much more data can be projected onto the digital map before it becomes cluttered and opaque? To what degree can this representational dilemma be overcome by a technical solution?
Further representational dilemmas lurk. A future ambition is to juxtapose global activity against continental activity by the United States. Of course, what is now thought of as “American” continental space was foreign and not sovereign for an extended time period in the nineteenth century, even if it was not overseas. It would seem extremely useful to examine not the scale but the scope of continental versus overseas activity of the United States, in order to determine their relative cultural importance measured along various data variables. In other words, when did “globalizing” become important not only with respect to American reach into the wider world, but within the full range of American life? Precisely what activities can be deemed commensurable across continental and overseas domains to gauge this?
New opportunities beckon as well. It has recently become technically possible to employ the same research database to generate sophisticated digital charts, graphs, and tables in dynamic conjunction with the digital map. As the digital map moves, so can these other data visualizations. A nice coincidence is that the nineteenth century, as an age of statistics, saw tremendous interest in the presentation of data in charts, graphs, and tables. We are in the very early phases of developing data visualizations to complement the digital map by contextualizing data along additional axes of analysis. So, for instance, if an overseas military action appears on the map, the user can choose to see everything else that might appear on the map in the same moment: the global extent and saturation level. But another data visualization could simultaneously show all other military actions for the same place over time, so that the user might in the same instant be lured down alternative research paths, perhaps the geographical, perhaps the chronological, or perhaps another context made available in a dynamically linked chart, graph, or table (one paying homage, ideally, to nineteenth-century graphic creativity).
All this continues to be very much a collaborative undertaking between me, a historian with some augmenting technical skill, and a set of collaborators with professional technical skills. There are other exquisite “historical GIS” projects on the Web, but our “globalization map” has definitely been a collective act of creation. And mine has not been the only learning curve. Instability that comes from filigree complexity and ceaseless innovation is simply inherent to the digital universe, I have come to realize. Mastery is not a condition so much as a continuous process, even for those who work primarily in the digital realm. This has obligated continual collaboration between the historical and the technical, the kind of collaboration that has stretched me far beyond the training of a dissertation or the task of a monograph.

There is another kind of collaboration at play—a collaboration with the unknown. We are mindfully developing and designing the “globalization map” to be both a model and a platform. First, its digital code will be shared as a model for projecting historical data onto historical maps, in contexts far beyond the nineteenth-century United States. Second, its database will be turned into a Web-based platform able to display data contributed by other scholars, because there is now so much exciting new scholarship being undertaken about the global activities of the United States in the nineteenth century which far exceeds my own humble research agenda.
There are things a digital map cannot do, of course. It can discern hidden patterns, but it cannot explain them. It cannot see ideologies or discourses. It cannot see domestic opposition or foreign resistance. It can show limits to imagination and action much better than it can show disputes or contests. It can show only the surface of conflicts.
But a digital map can process data, display data, and interrogate data on a significant scale and in striking and eye-opening ways. We hope that the “globalization map” can be a useful new tool with which to investigate early American history and the history of globalization; the proof lies in the users who employ it for research and for teaching.
We encourage Common-place readers to add to our list of digital resources for the study of early American history and culture by contributing to the Zotero group Suggestion Box for Common-place Web Library or by emailing suggestions to Web Library editor Edward Whitley (whitley@lehigh.edu).
This article originally appeared in issue 16.2 (Winter, 2016).
Konstantin Dierks is associate professor of history at Indiana University. Author of In My Power: Letter Writing and Communications in Early America (2009), he is currently working on a book about the globalization of the United States between the American Revolution and the American Civil War, from which this digital history project derives.