Overboard
A historian’s life at sea
The signal has three parts: one four-second blast followed by two one-second blips. It is that forlorn warning, a ship’s foghorn, and when I was on a sailing vessel in the middle of the Atlantic this past summer, we sounded it throughout the sixty hours of fog we endured between Sable Island and Halifax. The fog hit us just as my watch began a 23:00 to 3:00 stint, and it finally burnt off (“it seems only just,” our mate said, wearily) when we again stood watch on the morning we sailed into Halifax. Depending on the thickness of the fog and what the radar showed, we had to use the foghorn every four minutes, or every two minutes, or every minute. (Having been two weeks at sea, we were so tired that we easily slept through the din.) I asked our mate how close another ship would have to be to hear our signal. I couldn’t help but notice that he didn’t make eye contact or give much of an answer. Pretty close, I deduced, so I learned that fog could be fatal—still. I went to sea thinking I would learn about the social worlds of seafaring. My more valuable lesson was that nature matters, a lot, and that the way it mattered in the past is a part of history as elusive as it is important.
Why did I go to sea? I had been writing a book on Benjamin Franklin and science and had been researching Franklin’s maritime interests. Franklin produced some pioneering charts of the Gulf Stream—indeed, he and a cousin did the very first chart of that current. I had given many lectures and seminar presentations on Franklin and the Gulf Stream, and people kept asking me, “Have you seen the Gulf Stream?” How much better to say “yes,” I thought, and even better to say I’d seen it the way Franklin did, on a sailing ship. Sailing is a unique way to experience the past; were we able to resurrect Franklin and transport him to a modern sailing vessel, he would recognize much of its technology, terminology, and social order.
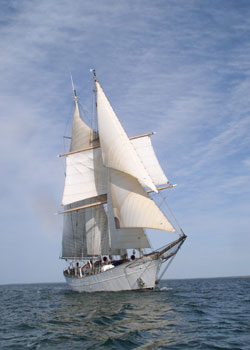
So I begged a place on a 140-foot brigantine, SSV Corwith Cramer, one of two multimasted sailing vessels that belong to the Sea Education Association (SEA) of Woods Hole, Massachusetts. I spent three weeks on the Cramer during May and June of 2004, cruising from St. George’s, Bermuda, to Lunenburg, Nova Scotia, and then to Woods Hole, where I disembarked and returned to my day job as a history professor. I returned to sea again for two weeks in June of 2005 (the other half of my household threatened to put a widower’s walk at the top of the house) and sailed from Woods Hole to Halifax, with that big foggy patch at the end.
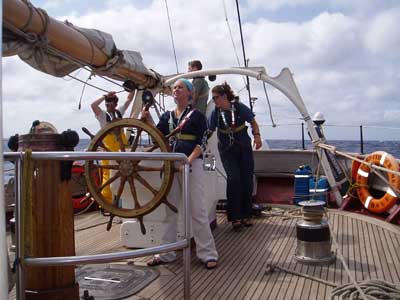
SEA promises to give college students a sense of the maritime past. Its students begin their journey on shore, with courses in maritime history and literature, alongside nautical science and oceanography. Students then go to sea to haul lines while singing shanties, preferably on four hours sleep at three in the morning, thus experiencing life at sea as it would have been in the age of sail. The students even learn celestial navigation, a technique that is no longer the standard on either commercial craft or holiday sailboats.
I earned my meals and berth by lecturing on maritime studies and doing my best to impersonate a deck hand. I told the students about the history of hydrography, an ancestor of ocenography; they showed me the ropes. Never had I worked so hard in the “classroom.” I knew I’d entered new pedagogical territory when one of the students, hearing that I was determined to tough out the seasickness without the drugs, yelled at me across the Cramer’s main salon, “Dude! Don’t be a hero!” Well, quite.
Being a professional historian, I’d always hooted at historical reenactors. I had lived in the South for almost fifteen years and had learned to dodge gray-clad weekend-Confederates when they clanked toward me, convinced I would appreciate their subtly distressed uniform buttons. Yet there I was, in the middle of the North Atlantic, counting “one Mississippi, two Mississippi, three . . .” under my breath as I plied the foghorn in the wee hours, desperately hoping the supertankers could hear us, a borrowed digital watch and a layer of fleece the only reminders of my twenty-first-century self.
But what version of the past was this? Was I really getting a taste of what life would have been like for someone like Franklin during his many months at sea? I decided to poll my fellow sailors—both the students, who sail for a six-week semester, and the crew, who’ve logged many hours at sea. Here are the results. (Note: this study followed none of the established protocols for valid social science research. Questions were leading; subjects, manipulated. Generalizations are blithely made.)
The Cramers (a ship’s sailors are known by its name) were a remarkably studious lot, given that 87.5 percent of them had read some Herman Melville, though only 40.6 percent had read any Patrick O’Brian—the modern master of maritime fiction. About 72 percent of them knew and sang shanties. Not that they were tedious pedants about historic accuracy. When I asked them whether they preferred Johnny Depp’s Captain Jack Sparrow in Pirates of the Caribbean or Russell Crowe’s Captain Jack Aubrey in Master and Commander, Mr. Depp beat out Mr. Crowe, 68 percent to 32 percent.
I also discovered that no less than 28 percent of the Cramers were tattooed; over 50 percent (men and women) could knit, crochet, or sew—skills that would have been highly valued among tars (as sailors were known in Franklin’s day), with their limited stocks of clothing. Only 3 percent were vegetarian though 34 percent used tobacco. They were absurdly sentimental: 50 percent had acquired, on the voyage, a keepsake for a loved one. When I asked what they missed most while at sea, 77 percent said a person, 19 percent said a substance (I avoided follow-up questions), and only one person (the engineer) said he missed some aspect of modern technology or popular culture. The Cramers, it seemed, had become living stereotypes of Jack Tar, that complicated fellow, alternately hopeless and cheerful, able to repair or rig anything, swearing a blue streak yet longing for his sweetheart (and perhaps tattooed with her name), smoking tobacco, and eating anything, ravenously.
The longer they’d been at sea, the more stereotypical the seafarers were. Only 17 percent of the students were tattooed, but 36 percent of the crew and officers were. Twenty-nine percent of officers and crew confessed that they swore more at sea than on land, as opposed to 5.5 percent of the student sailors; 79 percent of the former said they ate much more butter at sea, as opposed to 55 percent of the students. And then the real distinction: 29 percent of crew and officers had never, ever experienced sea sickness, while only 11 percent of students could make this claim. Certain people, not including me, were born sailors.
Whatever conclusions I might draw from my poll, it was becoming clear to me that life aboard the Corwith Cramer made for a pretty selective reconstruction of the past. The work routine and hierarchy on the Cramer were a far cry from those on naval vessels in Franklin’s era. At best, it resembled regimens in the merchant marine—a structured routine but without the gold braid and flogging. There was never any grog, the diluted rum that became a sailor’s staple in the eighteenth century. Shanties were sung but only that tiny, tiny percentage of shanties I began to call “hypoallergenic” because they offended no one. Traditional sailing technology dominated (sails and lines, bow-watch, steering with compass or by stars) except when we used radar, radio, and engine to avoid danger or maintain optimal position. Of course, a more authentic semester-at-sea adventure might have given students and, especially, their parents pause. SEA is quite right not to put college students through too many historically accurate ordeals. But the lapses in authenticity began to nag at me.
Not that I wanted to see rations cut or the grate rigged for flogging. But the emphasis, as with tall-ship enthusiasts everywhere, was on the age of sail’s cheerful and demotic aspects, the “Squeeze of the Hand” chapter of Moby Dick and the jolly, hearty bits of Patrick O’Brian, not the terrible maritime worlds of Barry Unsworth’s tale of an Atlantic slave ship Sacred Hunger, or Marcus Rediker’s social history of eighteenth-century sea-farers Between the Devil and the Deep Blue Sea, or Philip Curtin’s The Atlantic Slave Trade: A Census. Sing all the hypoallergenic shanties you like—your sense of the maritime past will be, for good or ill, approximate.
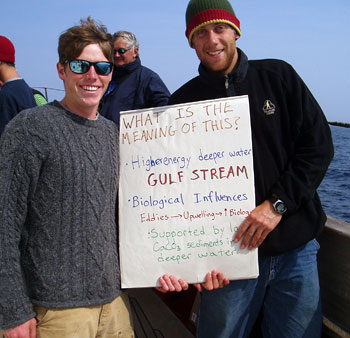
Eventually, I left the quarterdeck to all the bluff, salty types and, minding my inner nerd, drifted toward the Cramer‘s lab. Each SEA student must do a science project on either physical or biological oceanography. This meant an original contribution to science—indeed, SEA is now wondering what to do with the decades of data that its students have harvested under very difficult conditions.
We historians of science love to point out that science is not a universal practice, identical in every time and place. Boy, are we right. Science at sea makes you respect the tricky, shifty, and unwelcoming nature of what you’re trying to study. At sea, microscopy will invariably need to be done when you’re at your queasiest; net tows to collect biota will be scheduled for the coldest and darkest hours of the morning. Not cold and dark enough for you? Add rain and biting wind. Standing beside the lab, trying to do the hourly report on general conditions, the Beaufort Scale’s abstract, poetic sea states (State 5: “Moderate waves . . . many white horses are formed”; State 7: “Sea heaps up and white foam from breaking waves begins to be blown in streaks”) suddenly seem like fine gradations of misery. I’d read those Patrick O’Brian novels and assumed that naval Captain Jack Aubrey was their hero, but I now have new appreciation for naturalist Dr. Stephen Maturin, who never quite got his sea legs yet could steadily dissect rotting specimens, below deck, in a gale.
As I lectured on early modern hydrography, an interesting thing happened: students and crew alike saw resemblances between hydrography then and physical oceanography now. This surprised the historian of science in me, who had long assumed that hydrography and oceanography had about as much in common as medieval alchemy and modern chemistry. I kept countering, pointing to the profound differences between old and new ocean science, until I realized that “then” and “now” had one big, common context: the ocean. Most of the time, historical reenactors have to reconstruct the past’s physical environment, by wearing its clothing, eating its food, using its chamber pots. But maybe its natural environment does not need to be reconstructed. Fog is fog, right?
I’m not so sure.
The physical nature of the past has two sides, one human and one material. People have history; so does nature. Science has changed a lot over time. There’s no sense assuming that hydrography was just like oceanography—or that because it wasn’t like oceanography it wasn’t a real form of knowledge. People in the past thought about nature in ways that, to us, often appear quite strange and alien. We should not judge them for this nor should we minimize the changes in perception. Likewise, we should recognize that the natural world itself actually changes over time—witness our own climate or the dramatic decline in fish and whale populations. All of this makes it unclear whether descriptions or even data from the eighteenth century can tell us much about nature’s history. When it was collected, that material passed through minds that we historians still do not entirely understand. This fact makes it difficult to imagine that we will ever be able to make their data match our needs.
I decided that I wanted to see how far the gap between “then” and “now” or “them” and “us” might be and that, dear reader, is how I became a historical reenactor. Maybe reenactment of eighteenth-century science was going off the deep end. But cruising the Atlantic with a bunch of Johnny Depp fans was itself crazy, so why not go overboard? I did so by exploring two aspects of marine science that had interested Benjamin Franklin: charts of the ocean and variations in water temperature.
Charts of the open ocean were new in the eighteenth century. Over Franklin’s lifetime, determining the features of the deep sea was, like determining longitude, a considerable and mostly unsolved problem. Charts included the sea, but they had emphasized land—what navigators were trying not to run into. Even by the end of the eighteenth century, after John Harrison’s chronometer began to make determination of longitude easier, hydrographic surveys of the ocean were rare. It would be well into the nineteenth century before bathymetric maps, charts of currents, and large-scale surveys of sea-surface temperatures would be used to chart the open sea with any real detail. Previous efforts, such as astronomer Edmond Halley’s early eighteenth-century chart of magnetic variation over the Atlantic, were the exceptions that proved the rule.

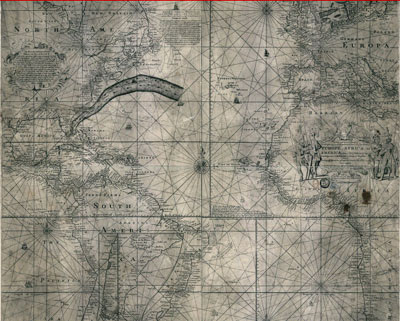
Another significant exception came in 1768 when Franklin and his cousin, Timothy Folger, created the first chart of the Gulf Stream. The two cousins did so to answer a question the commissioners of customs in America had posed to Great Britain’s arbiter of questions of commerce and communication, the Board of Trade: why did the postal packets traveling from Falmouth to New York take longer than those sailing from London to Boston, when the distance traveled appeared roughly equal? Franklin, one of the postmasters for the continental colonies, learned of the question and passed it to Folger, a Nantucket sea captain. Folger told him that the Gulf Stream, well known to Nantucket whalers (who harpooned prey along its edges), explained everything. Flowing hard to the east, the current slowed any ship (including packets trying to make New York from Falmouth) in its path.
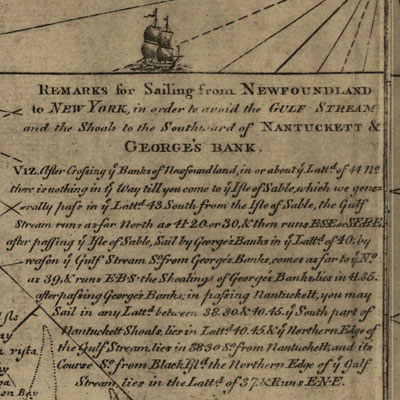
Franklin asked Folger to mark the dimensions of the Gulf Stream on a chart and then sent the manuscript to the Post Office to be engraved. The Post Office called on their contract stationer, Mount and Page (a grand, old maritime publisher), to provide a printed version, which the firm did by putting Folger’s sketch on an existing chart of the whole Atlantic Ocean taken from its Atlas Maritimus Novus (1702). There, almost drowned by the sea around it, the current surges up from Florida. Above it are Folger’s sailing instructions. Franklin would reproduce this chart twice more, once with a French firm, Le Rouge, during his diplomatic mission in Paris and once again in the second volume of the American Philosophical Society Transactions (1786), in “A Letter . . . Containing Sundry Maritime Observations.”
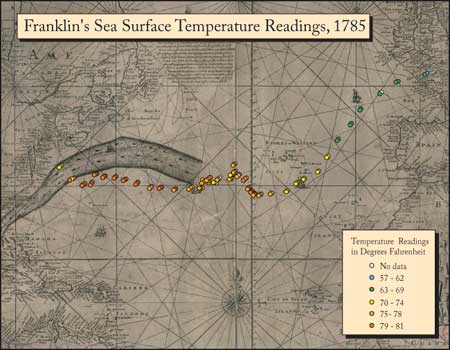
Franklin didn’t stop there. He also published, alongside this final Gulf Stream chart, data on sea-surface temperature readings he had collected on his final three Atlantic voyages in 1775, 1776, and 1785. These readings indicated Franklin’s conviction, not only that the Gulf Stream was warmer than the water around it, but that the temperature difference might help navigators determine where they were in the North Atlantic.
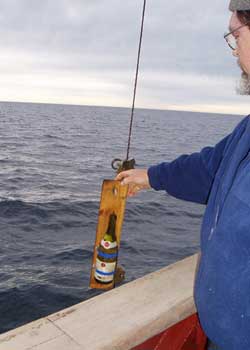
Then, Franklin went below the surface. On the very last of these three voyages, he and his grandnephew Jonathan Williams Jr. experimented with devices to collect samples of sea water in order to measure subsurface water temperatures. One of these was an ordinary wine bottle, emptied, recorked, and lowered on a line. Water pressure would eventually push the cork in, and the bottle would fill; as it filled, the water would wedge the cork back into place, creating a sample of water from the depth at which the cork had popped in.

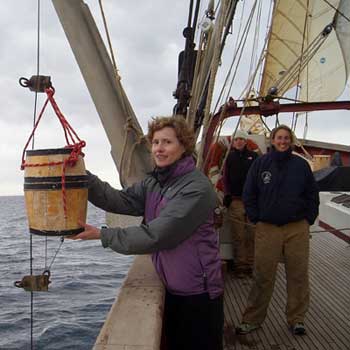
Their other water sampler was trickier. Franklin and Williams built it according to a prototype that Captain Henry Ellis had tested off the coast of West Africa in 1751. The Reverend Stephen Hales, a noted Newtonian experimenter, designed that instrument with brilliant simplicity: it was a wooden bucket fitted at top and bottom with unidirectional valves. Ellis rigged up the gauge according to Hales’s design. When it was weighted and lowered, water velocity pushed the valves open, filling the bucket; when the bucket was pulled up, the valves closed. Ellis had described this sea gauge in the 1753 Philosophical Transactions of Britain’s Royal Society. (The article directly followed one of Franklin’s classic essays on electricity, perhaps leading the great doctor to squirrel away its contents for use thirty years later when he and his grandnephew rigged a keg with the requisite valves.) The 1751 device leaked, but it confirmed what Hales had discovered: water well below the sea’s surface is considerably colder and gets colder the lower you go. Hales’s device had indicated what later oceanographers would call thermohaline circulation, the movement of cold water from equator to poles, deep in the ocean.
As my SEA students noticed, Franklin’s hydrographic interests (charts, temperature variation), rather amazingly, remain essential to present-day oceanography and nautical science. Many features of the ocean (tidal patterns, magnetic variation, depths of water) now appear on charts—seafaring is now much safer because of these printed guides. And temperature readings still indicate the presence of the Gulf Stream. Present-day images of the Gulf Stream, generated by satellites and infrared cameras, thus show the North Atlantic in bands of color, the warmest water a reddish orange and the cooler waters green or blue. The bird’s-eye view seems to capture, if only for a moment, every inch of the sea. Wouldn’t Franklin be pleased?
Perhaps not. By and large, technology has shifted the burden away from the sailor, who now needs much less knowledge of the sea. The global positioning system (GPS), especially, assumes that you can’t be trusted to figure out where you are. Instead, GPS satellites give you your coordinates and place them on the map: you are here. But are you? Built-in inaccuracy (justified on grounds of national security) makes parts of the GPS less accurate than its immediate predecessor, the Loran radio network. The Loran system allowed a ship to calculate position relative to radio signals from set points on the ocean. (Looking for a book topic? Please write on the Loran system.) Loran signals are still used for some commercial traffic, and the system is still discussed as a possible emergency back-up system for GPS. It’s an excellent example of how succeeding forms of technology don’t necessarily get successively better.
Nor are the new GPS-derived electronic maps of the oceans very thorough. A satellite map shows only an ocean’s surface, not its depths, which contain dynamics of interest to oceanographers and sailors. And even the thousands of available data points don’t account for every inch of the sea’s surface; they’re strung together to make a pattern—assuming, for example, that the water between a spot that’s seventy-four degrees Fahrenheit and one that’s seventy-six degrees must be no more than seventy-five degrees and representing it as such. The satellites capture a lot of stuff but not everything, and they may not always be improvements on what people once knew about the sea.
What did they know? Sailors and hydrographers had experience, memory, and imagination, and our technologies only roughly approximate those forms of knowledge. Long before satellites and infrared cameras, the whalers whom Timothy Folger consulted had experienced the Gulf Stream and, remembering the experience, described it to him. Folger then imagined the Gulf Stream as a visible current running for hundreds of miles in the ocean; no one saw the full sweep of it before satellite technology, but that didn’t prevent him from imagining what it might look like when seen from above. Meanwhile, Franklin imagined a connection between temperature variation and the visible current and then tested this hypothesis with his thermometrical readings.
That these were brilliant acts of imagination is even more apparent when Franklin’s data is mapped. He didn’t map it himself but Geographic Information Systems (GIS) software has made it easy for me to do so. For the most extensive run of data, from 1785, I averaged each day’s temperature readings, plotted them on a map (Franklin correlated his temperature readings to his ship’s position), and expressed them in colors, running from green (coolest) through yellow and orange (warmest). I then mapped the data over the 1768 Gulf Stream chart. The result shows a family resemblance between Franklin’s hydrography and modern day oceanography: we see the Gulf Stream as a fluid in motion (Folger’s running band of water) and as a set of temperature readings (Franklin’s data). Remarkably, Folger’s current and Franklin’s warmest points of water are, roughly, in the same place—allowing for annual and seasonal variations, it’s a surprising match and anticipates all those satellite images with whole spans of water differentiated by color. The biggest historical difference is the amount of data. Franklin had thirty-four data points, and the average satellite map has, well, more than you want to think about.
The avalanche of data comes at a cost: physical oceanographers have lots of numbers but rarely see what generates them—the sea itself. Just as on the Franklin-Folger chart, maps (paper or electronic) are flat representations of what the human eye can most readily see. Sailors used to have to construct all this in their minds, and they could only do so after considerable experience at sea. They learned to judge conditions (wind, waves, color of sea, presence of anything in the water) as indications of what they couldn’t see—fog-bound coastline, impending squalls, currents, dangerously shallow water. If you now sail with charts, radar, radio, and GPS, you get the information already formed into patterns. It is generally safer, though many sailors now worry whether, if all the technology failed, anyone on board would know what to do. When you’re fogbound, you fret about such things. If your or another ship’s radar gave out, would a foghorn be warning enough?
That’s why I decided to retest Franklin’s methods of data gathering, the wine bottle and the sea gauge. Maybe those techniques still had something to recommend them.
“Throwing old stuff overboard,” one of my maritime studies colleagues called it, even though I was using replicas—I’d be barred from museums everywhere if I ever tried to use the actual old stuff. (In many ways, my scheme followed the logic of the SEA program, in which students learn celestial navigation and use buckets to gather water samples.) Before I went on my 2004 SEA cruise, I had a carpenter cut valves in the bottoms of two wooden planters and stick the two planters mouth-to-mouth to make a keg. I caulked the keg’s seams with paraffin and twine then packed it in my checked luggage to Bermuda, where the customs officials looked at it, and me, very carefully. The night before the Cramer sailed, I begged several empty wine bottles and their corks from the head waiter in a local restaurant. And we were off.
Of course, the sea gauge refused to work on the sunny June afternoon when we first tested it. The wine bottle performed beautifully, to the gratifying amazement of the students. But the water sampler leaked water from its bottom valve. This failure was, at least, historically authentic—Franklin’s sea gauge had leaked, too! Everyone on board gave me advice; I took the engineer’s, and we rigged a tension line across the bottom flap, so it wouldn’t open all the way. We sent it down again at 2:25 the next morning, and its sample’s temperature reading, from a depth of 243 meters, compared pretty well with the reading that the ship’s fancy equipment gave: 5.0 degrees centigrade for the bottle; 6.41 degrees for the ship’s equipment.
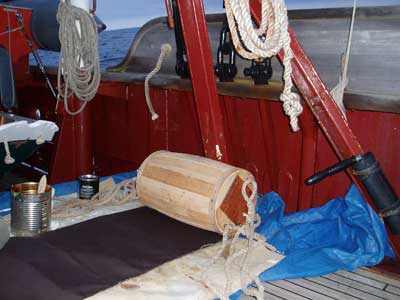
So I went back the next year with a collaborator, SEA maritime studies instructor Matt McKenzie, and a specially coopered keg. In honor of the Reverend Stephen Hales, I named this sea gauge the Rev II (the Rev I having given its all the year before). It seemed better than a pair of jury-rigged garden planters, but it too needed to be caulked. Matt and I eschewed paraffin as anachronistic and decided to use tar, so very seamanlike. Spreading a tarp over the Cramer‘s lovely teak deck, starboard at midship, we set to with brushes and got some students involved, in much the manner that Tom Sawyer got his fence whitewashed.
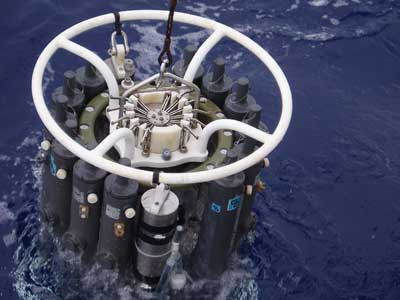
Meanwhile, on the port side, the official science people were using a standard oceanographic device, a carousel of Niskin bottles. Each bottle can be set to close depending on pressure data, so that each can capture water at a specific depth. The water samples can then be analyzed, especially for CTD (conductivity, temperature, density), and for mineral content. But the bottles didn’t work. Down the carousel went and up it came, bottles stubbornly undeployed. This happened three times in a row, at which point Matt and I strolled across the deck to offer them the use of our water sampler.
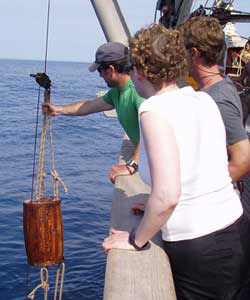
It still leaked, tar notwithstanding. Even worse, the depth of our final deployment, nineteen hundred meters, smashed the Rev II’s thermometer. But our reenactment made for a wonderful set piece on the history of technology. That both the archaic and modern instruments had failed made clear to the students just how contingent instruments are in general. It was a good day for history, if not for science.
Our historical instruments also gave a tangible, indeed tactile, demonstration of how data is not just a numerical value, much as modern science might lead us to believe. Depth, for instance, represents an actual section of the sea, a wet, salty point on the planet, some of whose qualities could, maybe, be explained in terms of temperature. If one purpose of a cruise on the Corwith Cramer is to experience the sea in a way no longer available to weekend sailors, then it was clear that old instruments could sometimes serve that purpose at least as well as, if differently.
Last summer, the Cramer‘s route took us over the Gully, a deep undersea canyon in Canadian waters. It is a protected area—equivalent to a national park—because of its unusual fauna, including the rare bottlenose whale. We were primed to make the most of the visit: two experts on the Gully, a geologist and a cetologist (whale expert), had sailed with us and gave background lectures on the canyon and its inhabitants. Within the protected waters, we could not run our engine, dump anything, or use our depth indicator (its “ping” annoys marine mammals and can disorient them). At last, we were as close to eighteenth-century sailing conditions as we could be. Our reward? Three bottlenose whales approached, rose, and sported around the Cramer. The humans scrambled for cameras and a good position along the rail or in the rigging.
Though it should have, it had never occurred to me that sailing ships afforded a better view of the sea (and its inhabitants) because they were as quiet as those residents. I began to wonder about the interaction between ships and sea creatures. I asked our onboard cetologist about our bottlenose visitors, “What do they think we are?” Did they think the ship was a thing and recognize us as fellow creatures? Or did they think the red-hulled ship was a creature, albeit with antic, camera-carrying parasites? Her reply pitied my ignorance—something to do with my sorry, anthropomorphic reliance on such terms as they, we, and think. Wrong question for a biologist.
But maybe it’s the right question for a historian. They, we, and think are meaningful terms for those of us interested in past nature and past science. I’ll use the terms with care, understanding the barriers between then and now, but I’ll use them. If that’s going overboard, I’m happy to take the plunge.
The author thanks Patrick Florance of the Harvard Map Collection for his help with GIS; Paul Joyce and Matt McKenzie of SEA for their comments on this essay; the SEA’s staff and crew for their patience with a historical reenactment, which is not a normal part of the SEA program; and David Armitage for his forbearance with a seagoing spouse and for many pieces of advice about life and science in the eighteenth century.
This article originally appeared in issue 6.2 (January, 2006).
Joyce E. Chaplin is professor of history at Harvard University and author, most recently, of the forthcoming The First Scientific American: Benjamin Franklin and the Pursuit of Genius (New York, 2006).