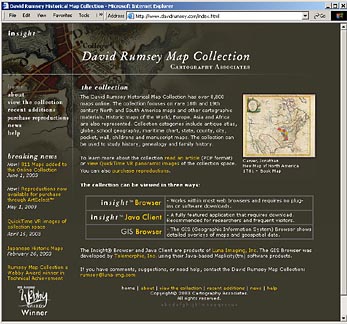
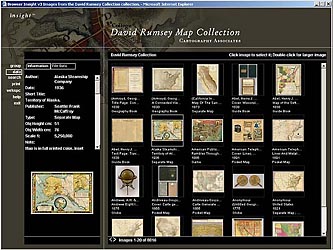
Over the past twenty years, with the help of dealers, bookstores, auction houses, and other collectors, I have collected more than 150,000 maps of eighteenth- and nineteenth-century North and South America. Scores of scholars, researchers, and others interested in history and the humanities have viewed the physical collection housed in San Francisco, California. The collection also features world maps, and includes atlases, globes, school geographies, maritime charts, and a variety of pocket, wall, children’s, and manuscript maps. Driven by an intense desire to make the collection available to the public in an intimate setting, in March 2000, I launched www.davidrumsey.com, a Website that allows free viewing of my maps via high-resolution images on the Internet. The Web site now has over eight thousand historical maps available for close examination. The sophisticated, yet simplified software allows visitors to view maps side-by-side, zoom in for inspection of the smallest details, as well as save and print. A comprehensive catalog provides information about each map’s cartographic relevance and provenance, author, the publisher and date of publication, and other historical and geographic facts. Users can launch a simplified browser-based viewer or download and install a feature rich Java client. The Website also has a browser-based geographic information system (GIS) viewer. The interactive Web GIS allows geographers, cartographers, and researchers to integrate historical maps with modern satellite imagery, aerial photos, and other geospatial imagery.
When I began collecting maps in the early 1980’s, eighteenth- and nineteenth-century American mapping was not a popular subject with most map collectors. Thus, I was able to assemble an expansive array of maps very quickly. As it happened, the cartographic publishing business in the United States was forming during the eighteenth and nineteenth centuries. American mapmaking businesses often were interconnected, such as those of Colton and Johnson, Melish and Tanner, and Finley and Mitchell. These relationships are important when trying to recreate a comprehensive cartographic history of the time.
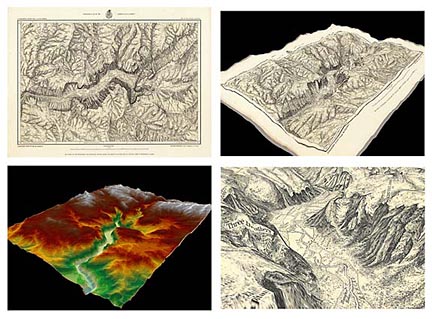
Because I wanted to record these relationships and other information about the maps as I collected them, I used a catalog database. The database not only preserved important information about the collection, but also allowed me to shape the growth of the collection with truly contextual collecting–seeing the relationships between the collected maps by subject, graphic type, time period, author or publisher, or geographic location. The use of a catalog database allowed me to see the collection in a data space and this allowed the shaping of the collection into a coherent whole. It also laid the groundwork for building the online collection, although I did not realize that until much later, when the Internet came into existence. Beyond atlases, the collection consists of individual maps, globes, puzzles, books with important maps (such as Lewis and Clark’s published accounts), charts, and cartography in ephemera and unusual forms. Maps by their nature connote many forms of expression: William Henry Holmes’s 1882 topographic drawing of the Grand Canyon is as much art as it is a map, and Samual McCleary and William Pierce’s 1850 wood puzzle titled, Geographical Analysis of the State of New York, is the earliest known map and children’s puzzle in the United States. It was a tool for teaching geography. Maps were also used in historical accounts: a large number of exploration books, government documents, and reports are part of the collection. They detail the official exploration and surveys used to map the United States as it expanded westward.

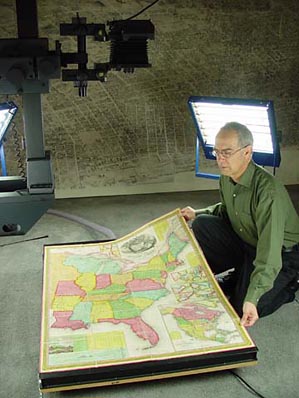
One of the special gems in the map library is John Melish’s Map of the United States published in 1816. This was the first large map to show the United States from coast to coast, and is considered a precursor of the later popular notion of Manifest Destiny. Melish was also a cartographic poet who, on the map, described the Texas panhandle as “Immense Plains of light salt sand mixed with fragments of Snail shells, moved with the wind, discovering Peaks of Volcanic Rock.” To make the collection available to a larger audience, I first considered publishing a print catalog, using the collection database as the source. However, this option would not allow people to truly study the original maps. With my growing interest in software and the Internet, around 1997 I decided to create a software program that would display my collection via the Internet, through collaboration with Luna Imaging. Placing the collection online and adding Internet GIS capability was no small feat. The site required years of time-consuming and careful scanning, experiments with several display and Web technologies, and GIS integration. During this time, I began the arduous process of converting historical materials to high-quality digital images, and converting my existing database catalog to an online catalog of my map library. My database catalog contains a detailed compendium of cartographic materials and notes to connect the items. This record was quite useful in developing the online cataloguing system during the scanning process. Complete atlases were scanned, as were covers for pocket maps, puzzles, and their cases. Folding globes were shown compressed and then opened, and maps were shown enclosed within books. Each subset or group within the collection has a unique number to tie all of its components together. Individual items in the group have derivations of the unique number, and by numbering each record sequentially, the items appear together and in the correct order. Thus, if one searches for an entire atlas, all of the pages will come up together and in the proper order. In addition, when browsing, the cover for a map will appear next to the map itself. I was also able to create digital composite images of maps that were intended to be joined by the cartographer and engraver but were separated in the bound books. An example is Henry Popples’s 1733 Atlas of the British Empire in America. On March 15, 2000, the map library site was launched on the Internet with more than twenty-three hundred maps. The number of visitors to the site in the first few months was astonishing: we averaged over ten thousand visitors a day. Feedback from users was immediate and revealed that a number of K-12 teaching resource groups, Civil War buffs, university map libraries and history departments, home schoolers, and the general public were keenly interested in this type of online library. Since the launch date over two million people have visited the site and used its resources. By 2001, I was working with Telemorphic, Inc., a GIS software developer, to modify their Web browser for general image analysis and visualization. We specifically tailored the software to allow people to see four different maps at the same time. The Quad View feature enables people to view a historical map next to other historical maps as well as contemporary satellite imagery or modern raster and vector data of the same area.
We decided to use the most readily available source of current map data: the United States Geological Survey (USGS). In addition, we faced another technical limitation in not being able to integrate current data with the thousands of maps on the site all at once. As a result, we decided to develop the Web GIS on a city-by-city basis, then move on to regional, state, and county levels. We focused on the San Francisco Bay Area first, obtaining digital orthophotos, topographic map sheets, digital elevation models (DEMs), and satellite imagery from the USGS Bay Area Regional Database. We quickly learned that just having the data wasn’t sufficient. We needed to rectify the digital images of the historical maps to an accurate geographic basemap so that they had common reference frames. This process of “warping” historical maps to modern geographic reference data was challenging. Many historical maps were created before the availability of modern mapping and surveying technologies, and some of the items were tourist maps that were visually surveyed or based on an artist’s rendering.
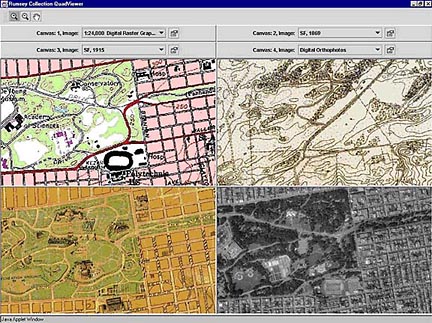
By December 2001, we had completed integration of eleven different maps of the San Francisco Bay Area, from the mid-1800’s through early 1900’s. Soon thereafter, we added Boston, Massachusetts, and Washington, D.C. The site has a basic and professional GIS interface intended to allow people of various skill levels to move easily through a series of visualization processes and create, save, and print their own custom maps. Users can also download new image products with complete georeferencing information (world files) for integration into their preferred desktop GIS package. Adding the GIS feature to the online collection is giving mapping professionals a unique opportunity to learn from the past. Stephen Skartvedt, a GIS specialist for the Golden Gate National Recreation Area, sees many advantages of the new GIS site for his organization. Because Golden Gate Park is now, to a large extent, an island surrounded by development, Skartvedt says the historical maps provide visual confirmation of the value of protected land and show the pace of development in a typical urban setting. Being able to share historical maps across the Web in an interactive environment has proven more rewarding then initially imagined. Response from cartographers, geographers, and GIS professionals has been very enthusiastic. The latest new dimension to the online GIS experience is three-dimensional viewing and fly-through sequences. Visitors can now fly-through parts of California in the late 1800’s such as Yosemite Valley and Los Angeles in 1883, and Lake Tahoe in 1876. Expansion of the current GIS data sets will continue, adding more cities and more historical detail, such as fire and insurance maps and hand-drawn land parcel/ownership maps, along with more current satellite and aerial imagery, topographic map data, and detailed street information. We also plan to increase the level of interoperability between the site’s Luna Imaging browser and the GIS service, so that users can click on a spatial feature in the GIS view and immediately launch the image browser to see a corresponding map or drawing with more detail.
Soon people will browse multiple map collections at once, comparing maps from widely dispersed institutions in a common Internet space. Currently, I am working with several major public map collections interested in achieving this broad goal. One of these joint ventures is with the University of California at Berkeley. A collaboration with the University of California’s East Asian Library has made their collection of rare and fragile historic maps of Japan, some of which date back as far as four centuries, available. More than two hundred maps, including examples of rarely seen woodblock print maps of the ancient city of Edo, modern-day Tokyo, are now available online. Thirteen of the Tokyo maps, dating from 1680 to 1910, were also added to the GIS browser. Additional historic maps of Osaka, Japan, and Kyoto, Japan, have been added to the site as well. I am also working to establish many different ways that the online map collection can be found and accessed by users. We have contributed most of our records to the Open Archive Initiative. Several OAI based search engines are developing, an example being the University of Michigan’s OAIster, where our maps can be found along with millions of other documents and images. Our records and images can also be found on popular search engines like Google. We create automatically an individual Web page for each of our records, and the Google data “spiders” catalog and index these records. Google currently has over sixty-five hundred record pages from my site. We contribute our data to the ESRI Geography Network, a shared GIS database, and to the ECAI Meta Data Clearinghouse, a GIS database for historians. With the help of the University of California, we are putting all our records with links to the map images into the OCLC catalog, where they can be downloaded and added to library OPACs–UC Berkeley has added over forty-five hundred of our records to their online catalog. We will continue to add new ways for people to find and intersect with our information via the Web. Historical maps reveal amazing tales about towns, boundaries, politics, geographic features and early landscape values, and how they changed or vanished with modern development. The very existence of high-resolution map imagery on the Web will bring these beautiful and important materials to the attention of the general public and scholars in ways that have not been possible before. Thanks to the Web and GIS, historians, artists, geographers, cartographers, and others can reconsider their understanding of history.
This article originally appeared in issue 3.4 (July, 2003).
David Rumsey is the founder of the David Rumsey Map Collection and president of Cartography Associates. He is the author, with Meredith Williams, of “Historical Maps in GIS” and, with Edith M. Punt, of Cartographica Extraordinaire: The Historical Map Transformed (Redlands, Calif., 2003).